 Two decades ago China’s economy was roughly a quarter the size of the U.S. economy. Today the economies are of roughly equal size, each producing about $17.5 trillion worth of goods and services based on an economic concept known as purchasing power parity (PPP). The concept discounts the effects of under-valuation or over-valuation of a particular currency.
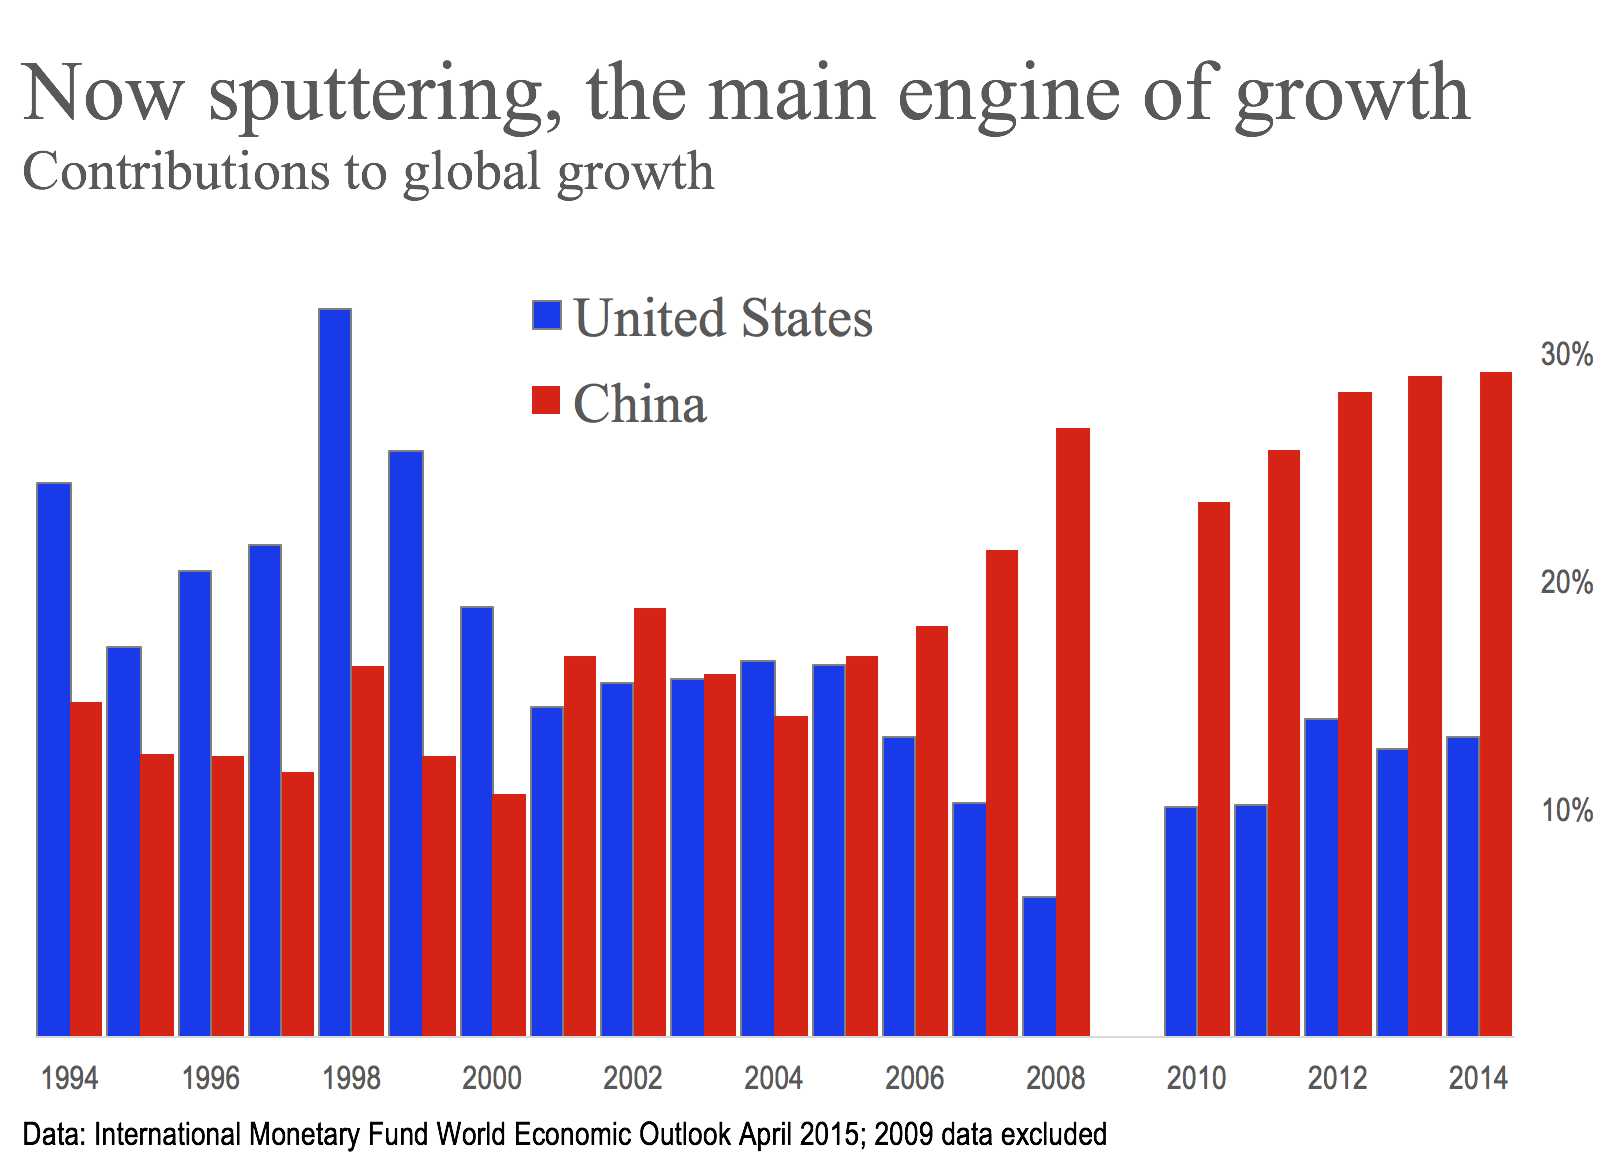
As recently as 1998, the United States accounted for nearly twice as much of global economic growth (32%) as China (16%). But China’s contribution to global growth overtook that of the U.S. in 2001 (a recession year in the U.S.). From 2003 through 2005, the two contributed roughly equally to global growth.
The chart shows what has happened since. We’ve excluded 2009 data from the chart. In the Great Recession, China’s contribution went off the chart, which is to say that if we included data for that year, every other year would look insignificant on the vertical or Y axis.
Especially over the past five years, China has become the principal engine of global economic growth. The U.S. has contributed to global economic growth at half or less of the China rate.
The chart helps explain why global stock markets have freaked out at the prospect of much slower growth in China.
China’s pell-mell economic growth has lifted millions out of poverty. But we in the advanced economies needn’t feel threatened by China’s growth. In nominal dollar terms, China’s per-capita income at $7,600 is only about a seventh of U.S. per-capita income, estimated at $54,496 in 2014.